Top 30 U.S. Ports: U.S. Seaports Persevere
While managing significant volume swings driven by the pandemic and ongoing geopolitical issues, U.S. seaports continue to press forward with efforts to improve infrastructure and build in efficiencies an unwavering attitude that bodes well for the future.
Related Slideshow

Our top sources contend that U.S. seaports are in relatively good shape today compared to two years ago when faced with congestion issues caused by pandemic-related cargo surges.
“U.S. Ports were looking to be in decline for all of 2023; however, the last three months showed an increase in volume over 2022 imports, particularly in December, where we saw a 9% increase in volume for 2023 compared to December 2022,” says Spencer Shute, principal consultant a global supply chain consultancy Proxima. “Overall, 2023 ended with a nearly 12% decline in container volume compared to 2022.”
While volumes trended down last year, analysts see these totals more normal.
“The overall decline in volumes was heavily driven by supply chains beginning to flow in a more pre-pandemic fashion,” observes Shute. “The backlog from pandemic disruptions largely subsided due to reduced demand.”
Additionally, economic uncertainty in the first half of 2023 drove consumer demand down, which made an impact on container volumes. “However, consumer spending began to increase toward the end of 2023, with some improvements in the economic forecast,” Shute adds.
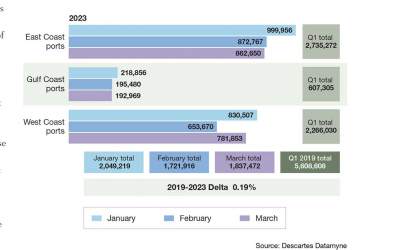
Technology and trade intelligence provider Descartes reports that for 2023, port volumes are up 4.6% compared to the pre-pandemic year of 2019. Descartes data shows a 11.7% decline in 2023 compared to 2022.
“But such a comparison can be deceptive,” says Chris Jones, Descartes executive vice president of industry. “Volumes in 2022 were much higher due to the pandemic-based demand and a very strong economy in the first half of 2022. The second half of 2023 compared to the second half of 2022 shows the difference is only 2.1%.”
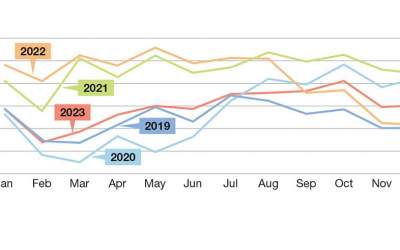
London-based supply chain consultancy Drewry figures that for leading U.S. container ports for January-November 2023 reveal that container volumes are down by an average 15% year-over-year, but marginally ahead of the same period in 2021.
“U.S. container volumes rose steeply from the second half of 2020 until the first half of 2022 when consumer spending switched to goods rather than services during the pandemic,” says Eleanor Hadland, senior analyst, ports and terminals at Drewry. “Port volumes started to fall in mid-2022, and to a large extent this is a correction back to pre-pandemic growth trends.”
| Rank | Port of Arrival | 2023 TEUs | Percentage |
| 1 | LOS ANGELES, CA | 4,416,942.91 | 17.72 |
| 2 | NEW YORK/NEWARK AREA,NEWARK, NJ | 3,979,982.25 | 15.97 |
| 3 | LONG BEACH, CA | 3,756,522.95 | 15.07 |
| 4 | SAVANNAH, GA | 2,410,082.15 | 9.67 |
| 5 | HOUSTON, TX | 1,800,305.67 | 7.23 |
| 6 | NORFOLK, VA | 1,461,862.61 | 5.87 |
| 7 | CHARLESTON, SC | 1,220,595.07 | 4.9 |
| 8 | OAKLAND, CA | 822,248.05 | 3.3 |
| 9 | TACOMA, WA | 701,028.46 | 2.82 |
| 10 | MIAMI, FL | 530,033.33 | 2.13 |
| 11 | BALTIMORE, MD | 527,443.08 | 2.12 |
| 12 | SEATTLE, WA | 464,648.82 | 1.87 |
| 13 | PHILADELPHIA, PA | 430,306.65 | 1.73 |
| 14 | PORT EVERGLADES, FL | 327,319.82 | 1.32 |
| 15 | MOBILE, AL | 285,710.42 | 1.15 |
| 16 | JACKSONVILLE, FL | 210,996.54 | 0.85 |
| 17 | SAN JUAN, PR | 195,839.23 | 0.79 |
| 18 | WILMINGTON, DE | 185,440.09 | 0.75 |
| 19 | CHESTER, PA | 130,089.34 | 0.53 |
| 20 | BOSTON, MA | 121,350.75 | 0.49 |
| 21 | PORT HUENEME, CA | 119,987.76 | 0.49 |
| 22 | TAMPA, FL | 117,941.00 | 0.48 |
| 23 | NEW ORLEANS, LA | 117,351.87 | 0.48 |
| 24 | WILMINGTON, NC | 111,532.51 | 0.45 |
| 25 | PORT MANATEE, FL | 86,138.01 | 0.35 |
| 26 | GULFPORT, MS | 83,437.42 | 0.34 |
| 27 | SAN DIEGO, CA | 77,708.00 | 0.32 |
| 28 | PORTLAND, OR | 48,637.65 | 0.2 |
| 29 | FREEPORT, TX (5311) | 45,802.00 | 0.19 |
| 30 | WEST PALM BEACH,FL | 32,504.22 | 0.14 |
| Total | 24,928,914.49 | 100 |
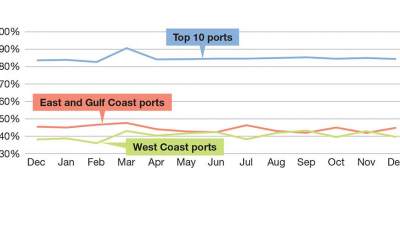
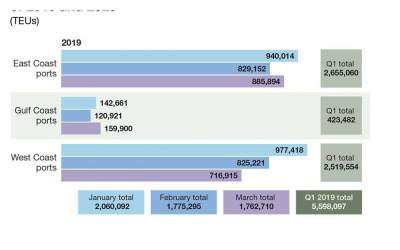
Regional trends
A closer look at volumes for the last four years at East, West, and Gulf Coasts ports shows how market leadership bounced back and forth between each region’s leading ports. The reasons: major events such as port congestion, pandemic-driven demand spikes, and labor relations.
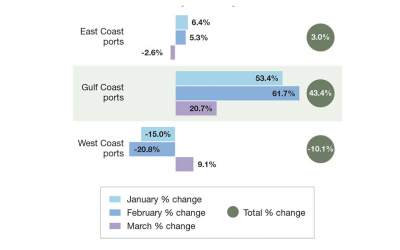
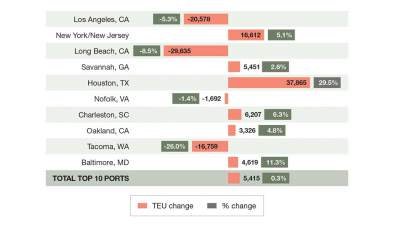
The top Gulf Coast ports, especially the Port Houston, benefitted the most. Descartes attributes the increase to cargo shipments of electronics, furniture and machinery typically associated with Asian manufacturers.
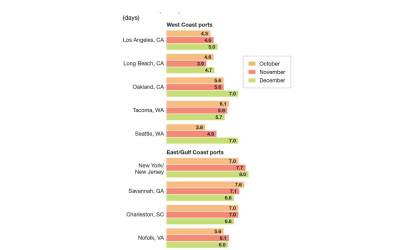
Jones notes that Gulf Coast ports had their volume negatively affected in November, but the volume bounced back in December. “However, port transit time delays did increase by two days in December,” he says. But issues with the Panama and Suez Canals and more labor contract negotiations may see those gains slip away, he warns.
Drewry concurs that the ports benefited from the strength of export flows, but notes that the Port of Houston saw a 4% drop in volumes between January-November 2023. And, comparison, Drewey data reports a 14% decline between January-November 2023 across the four main ports on the West Coast in the first half of 2023 due to the labor dispute.

“Although actual disruption caused by the dispute was quite low, shippers chose to reroute some cargo to avoid the risk of disruption,” Hadland says. “Shippers also had concerns regarding risk of railroad strikes.”
West Coast ports did see a recovery in volumes in the second half of 2023 due to labor settlements. The drought restrictions on Panama Canal also resulted in some cargo coming through the West Coast rather than Gulf or East Coast ports, says Hadland, adding that Mexico’s main West Coast ports fared even better with a 2% gain between November 2022 and November 2023—thereby indicating their integration into
global supply chains.
On the East Coast, Drewry reports a 17% drop in volumes from January-November 2023 across the Port of New York/New Jersey, Port of Savannah, and Port of Virginia. “Congestion remained an issue at East Coast ports,” says Hadland, although she expects the East Coast to win market share over the longer-term.
Hadland projects West Coast gateways will continue to gradually lose market share due to major shippers diversifying production into Southeast Asia and South Asia, which favor Suez-routings direct to East Coast ports.
Jones notes that the major shift in TEUs to the West Coast may take a while. “Rerouting trade flows is not trivial,” he says. “However, the Panama drought, the conflict in the Middle East impacting the Suez Canal, and this year’s ILA contract negotiations [on the East Coast] could accelerate that movement.”
Daniel Hackett, partner, Hackett Associates and one of key authors of Port Tracker, adds that rail out of West Coast ports particularly makes them attractive gateways.
Port improvements
In addition to the impact of external factors, U.S. seaports are making ongoing efforts to improve infrastructure and build in efficiencies. “Ports across the U.S. are focused on improvement projects to increase capacity, improve efficiency, and reduce bottlenecks,” says Shute.
Fueled by the $653 million federal investment through the Port Infrastructure Development Program (PIDP), Shute says that ports are exploring all areas of improvement, from automation, capacity improvements, and increased sustainability to reduce environmental impact.
The Port of New York/New Jersey, for example, will see additional terminal capacity come online as a result of the acquisition by CMA CGM of Bayonne and Staten Island container terminals last August. CMA CGM is targeting an increase of the terminals’ capacities by over 50% within 10 years, including the continued development of Bayonne’s Berth 3, which will have the capacity to handle 18,000-TEU vessels. The company will also expand yard and berth capacity to improve operational fluidity at both terminals.
The Port of Virginia is investing $1.4 billion to expand its capacity and cargo handling capabilities. The port is nearing the end of its dredging to 55 feet, which will make it the deepest port on the East Coast. Other expansions include the taking delivery of equipment for the expansion of the Central Rail Yard at Norfolk International Terminals and expanding the North Berth at Norfolk International Terminals.
The Port of Long Beach is undergoing a $1.57 billion rail project that will enable the seaport to move more cargo by rail. This will ease congestion and lessen local environmental impacts. Construction is expected to begin next year.
U.S. ports are also working to reduce their environmental footprints. Both the Ports of Los Angeles and Long Beach are pressing forward under the 2006 Clean Air Action Plan to meet deadlines for terminal equipment and trucks to go to zero-emissions by 2030 and 2035, respectively. They also signed on with China’s Port of Shanghai to work towards the first green shipping corridor across the Pacific Ocean.
In fact, the Port of Virginia is powering all its terminals with electricity from clean resources and accelerating its goal to becoming carbon-neutral by 2040. “Virginia is the first major U.S. East Coast port to power its entire operation using 100% clean electricity,” said Stephen Edwards, CEO and executive director of the Virginia Port Authority.
Top U.S. Ports: Time to go with the FLOW
During the pandemic, ports, especially those on the West Coast, faced unprecedented surges in cargo volumes that resulted in overwhelming congestion.
“Today, ports have become ship ready,” says Daniel Hackett, partner at trade data provider Hackett Associates.
Helping to better prepare them for freight volumes is the U.S. Department of Transportation’s Freight Logistics Optimization Works (FLOW) program. The program began in March 2022 when the ports of Los Angeles and Long Beach were experiencing overwhelming congestion.
The FLOW program measures the nation’s cargo traffic demand against infrastructure and equipment supply, leading to a novel approach to optimize the use of supply chain assets.
“FLOW helps ports get a handle on the way cargo is moving,” adds Hackett.
Essentially, the program works with all facets of the supply chain so that logistics managers can identify potential bottlenecks and track goods from the dock to final destination. The goal is to forecast containerized freight volumes and provide timely and accurate asset supply at system nodes.
Today, all terminals at the Port of Los Angeles, three of the four terminals at the Port of Long Beach, the Container Terminal at the Port of New York/New Jersey, the Port of Savannah, and Port Houston are participating.
According to DOT officials, however, the biggest hurdle to FLOW is convincing logistics companies and ports to share data.
Outlook for 2024
While analysts expect economic conditions to improve in 2024, what impact events in the Red Sea and the drought in Panama will have on U.S. ports is yet to be seen.
Both the Suez and Panama canals are critical to global and transcontinental trade, and analysts note that the fallout from these external issues is affecting supply chains.
Matthias Menck, principal consultant at Proxima, predicts that, in the short-term, the events in the Red Sea will result in ocean-freight costs for shipments bound for the East Coast from China to continue to increase in price.
“Prices are already up by 52% since the crisis in the Red Sea began as ships looks to reroute around South Africa as part of their trans-Atlantic route, leading to a delay of up to three weeks,” says Menck. “While East Coast shipments are bearing the brunt, businesses are increasingly looking to reroute shipments entirely to West Coast ports, pushing up prices there as freight firms adjust their capacities. Businesses are now looking at spending $1,000 more for West Coast shipments than they were before the situation in the Red Sea began.”
Shute notes that while the overall decline in container volume has made the impacts of drought in the Panama Canal less noticeable in the U.S., container volumes have rebounded to the point where the Ports of Los Angeles and Long Beach have taken over as the market leader in terms of import volume.
“We could see volumes continue to favor West Coast ports over the next nine to 10 months depending on drought conditions and overall import volumes,” adds Shute.
Current events certainly have altered what analysts previously saw as the No. 1 concern late last year. That was overcapacity issues that were expected due to the large number of ship deliveries in 2024 and 2025.
Stefan Verberckmoes, an analyst at shipping data provider Alphaliner, warned that the market would not be able to absorb this overcapacity, and therefore, could cause a repeat of congestion at seaports.
However, now with restrictions on passage through the Panama Canal and the dangerous situation in the Red Sea, ocean carriers are absorbing over-capacity by slow steaming and taking alternative routes. “These could be temporary, however,” adds Verberckmoes

Article Topics
Alphaliner News & Resources
Top 30 U.S. Ports: U.S. Seaports Persevere Ocean Carriers Trends 2024: Unprecedented uncertainty Top 30 Ocean Carriers: Riding high on wave of profits Ocean Cargo: Post-pandemic strategies take hold Quarterly Transportation Market Update: State of Ocean Cargo Anticipating a Sea of Change Ocean Cargo Update: Reversal of Fortune for Rates?Latest in Logistics
Understanding the FTC’s ban on noncompetes UPS rolls out fuel surcharge increases U.S. rail carload and intermodal volumes, for week of April 20, are mixed, reports AAR Baltimore suing ship that crashed into bridge, closing port, costing jobs Intermodal growth volume remains intact in March, reports IANA Descartes announces acquisition of Dublin, Ireland-based Aerospace Software Developments Amid ongoing unexpected events, supply chains continue to readjust and adapt More LogisticsSubscribe to Logistics Management Magazine

Find out what the world's most innovative companies are doing to improve productivity in their plants and distribution centers.
Start your FREE subscription today.
April 2023 Logistics Management

Latest Resources


